RUN MECHANICS & EFFICIENCY
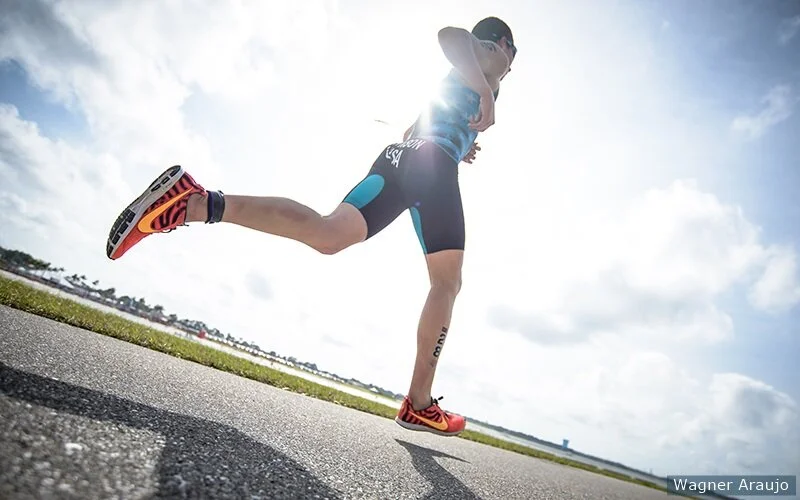
Most runners are chasing the wrong number
Ground contact time gets all the attention on race-day watch data. The evidence says it barely matters. Here's what actually moves running economy — and what to do about it.
Two athletes can share the same VO2max and still differ in running economy by roughly 20 percent — meaning one of them covers the same ground at a meaningfully lower physiological cost. That gap isn't fitness. It's mechanics, and it's coachable.
Every modern running watch now reports ground contact time, vertical oscillation, cadence, and stride length after nearly every run. The problem is that most athletes — and more than a few coaches — assume all four metrics carry equal weight. They don't.
What running economy actually means
Running economy is the energy cost of sustaining a given submaximal pace — typically measured as the oxygen consumed per kilogram of body weight to hold a fixed speed, or as the energy cost per unit of distance covered. It's distinct from VO2max, which measures the size of an athlete's aerobic engine. Economy measures how efficiently that engine converts into forward motion at race pace.
VO2max is engine size. Running economy is fuel efficiency. A smaller engine with better economy can out-perform a bigger one that burns energy inefficiently — which is exactly why mechanics are worth coaching, independent of fitness.
The metric everyone chases that barely matters
A 2024 systematic review and meta-analysis in Sports Medicine pooled the observational research on running biomechanics and economy. The finding that should change how your team reads its own watch data: ground contact time showed a trivial, non-significant relationship with running economy, alongside flight time and duty factor ¹. Meanwhile, a higher step frequency — cadence — showed a weak but real association with better economy, and lower vertical oscillation along with higher leg stiffness showed a moderate association ¹.
"Stop chasing a lower ground contact time in isolation. Coach cadence and vertical oscillation instead — that's where the evidence actually points."
That reordering matters because GCT is the number most GPS watches surface first, and the one most athletes fixate on trying to shrink. The data says your time is better spent elsewhere.
Cadence: there's no universal 180
Cadence follows a U-shaped curve with running economy. Experienced runners tend to self-select a cadence slightly below the theoretical optimum; novice runners self-select well below that ². There isn't one target number that fits every athlete on the roster.
What does hold up: a 5 to 10 percent increase over an athlete's own preferred cadence reduces energy absorption at the hip and knee, lowers braking impulse, and reduces peak hip adduction — the same mechanical factors tied to IT band syndrome and patellofemoral pain ². Coach the delta from the individual's own baseline, not a flat number pulled from a magazine article.
Vertical oscillation: run tall, not up
Excess vertical displacement burns energy moving the center of mass up and down instead of forward. It's driven by overstriding, low cadence, a weak posterior chain, or fading trunk control late in a long race — and unlike GCT, reducing it is moderately associated with better economy ¹.
Minimize bounce, maximize forward drive. Pair the cue with posterior chain strength work — a stiffer, more elastic push off the ground is what actually lowers oscillation, not just thinking about it mid-run.
Stride length fixes itself
Staying within about 3 percent of an athlete's own preferred stride length captures most of the available benefit — lengthening it artificially doesn't ¹. Overstriding, where the foot lands well ahead of the center of mass, is the real problem: it raises braking force, vertical loading rate, and ground contact time all at once. It's a symptom of low cadence, not an independent flaw to coach directly.
The fix is the same cue that fixes cadence: quicker feet naturally shorten an overstride without ever mentioning stride length out loud.
Reading a file: what this looks like in practice
Numbers on a screen only become useful once you know how to read them together. Here's a real example: a highly trained runner on an easy run — high Zone 1 to low Zone 2 — with 2 times four short Zone 4 strides woven in to open up his legs.
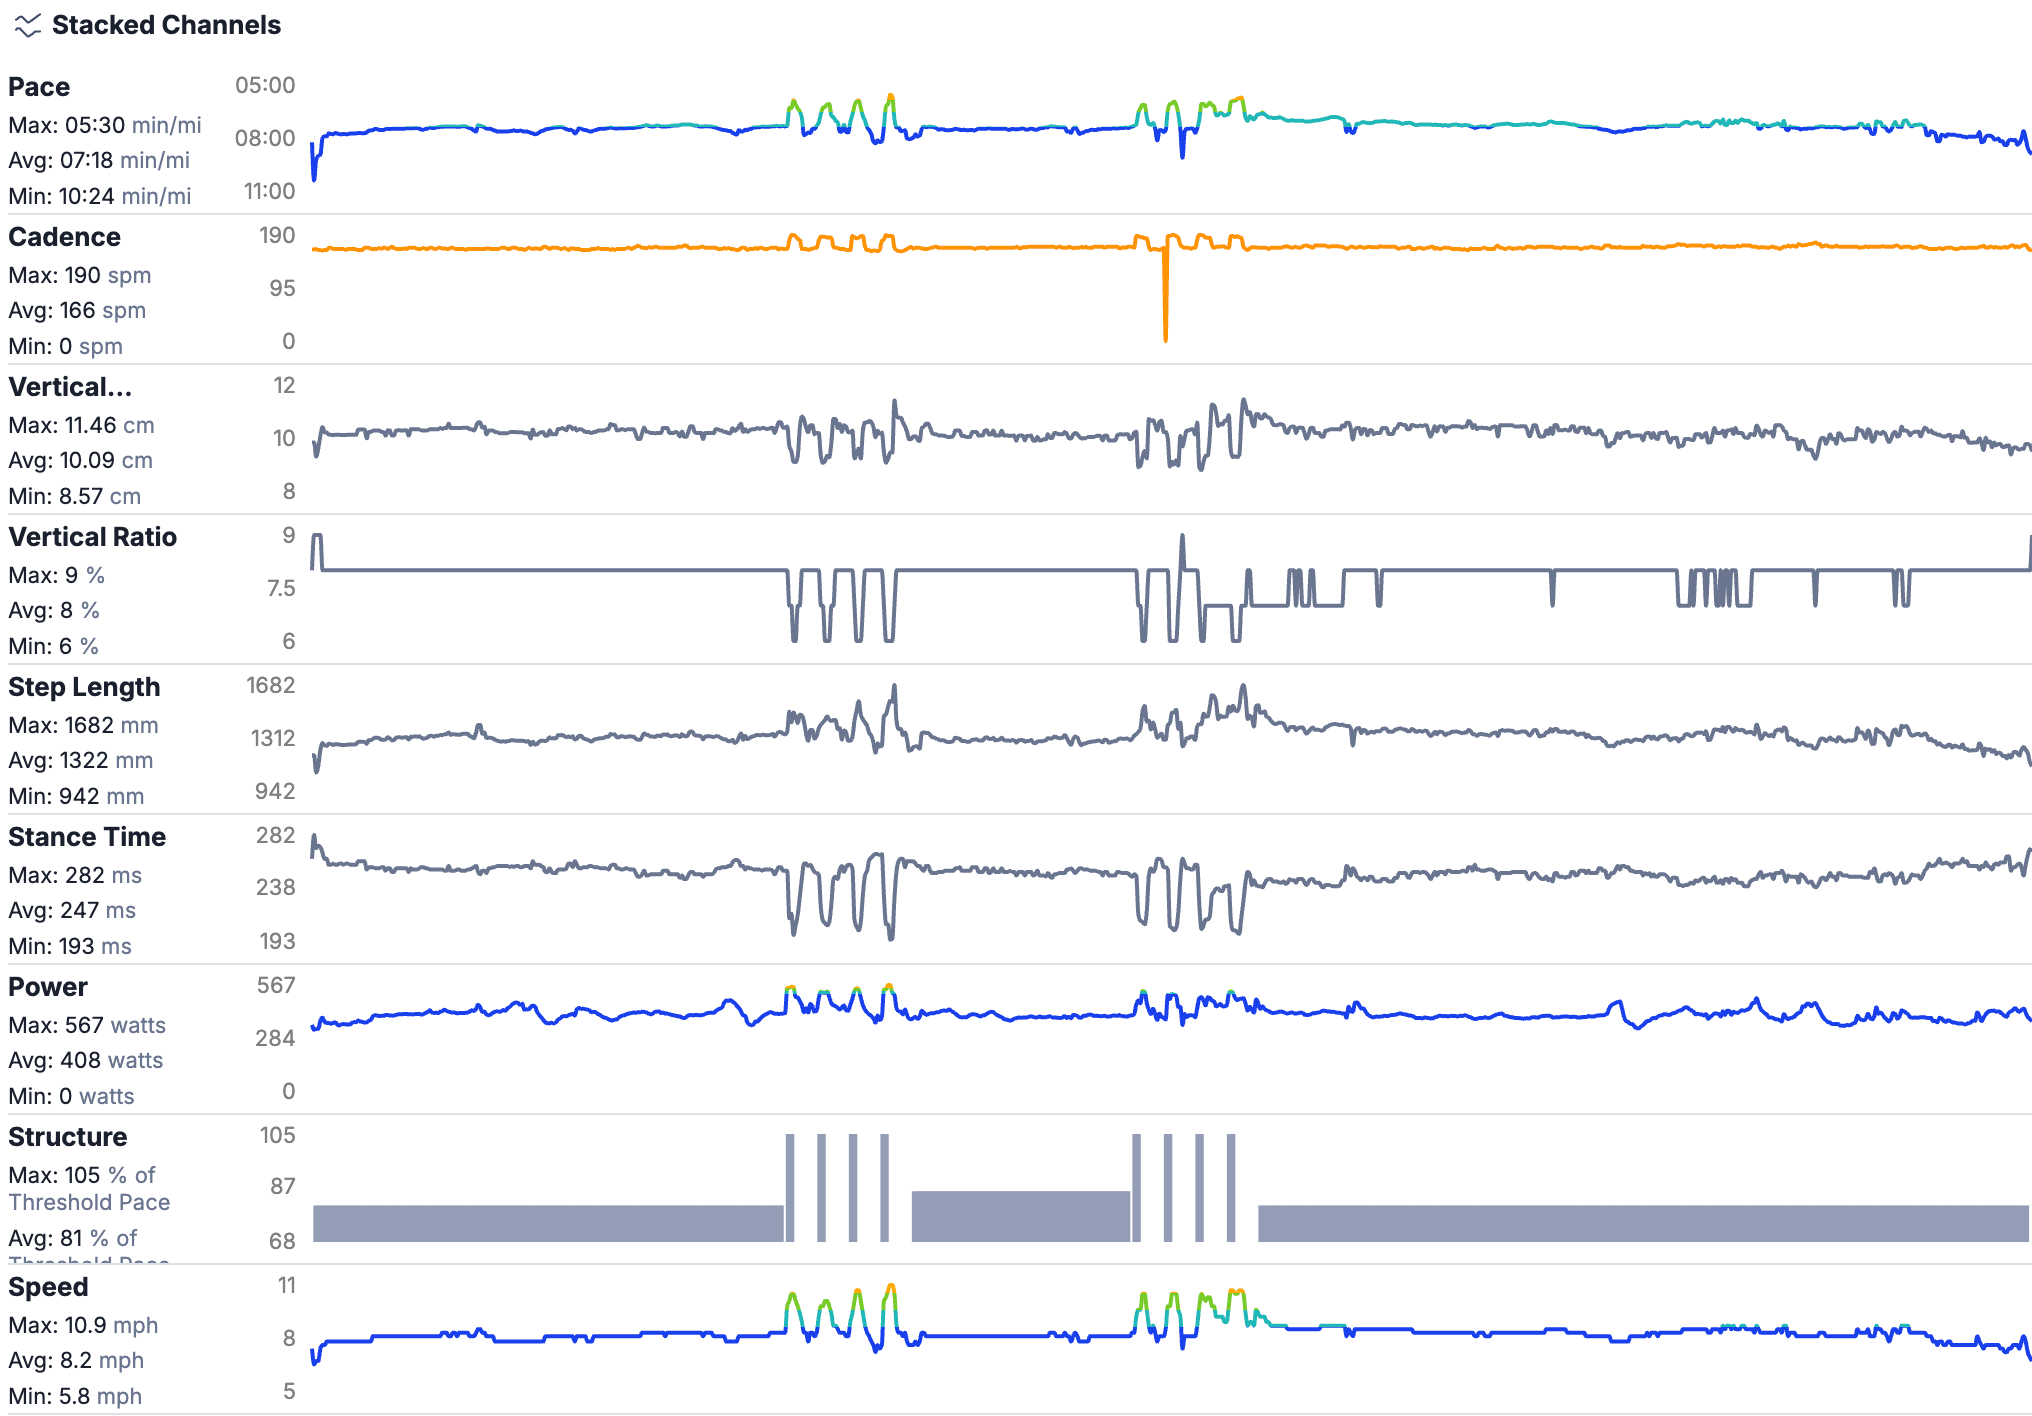
Cadence rose only modestly — it had little room to give at that baseline. Stride length opened up roughly 25-30 percent, and vertical oscillation rose only about 14 percent alongside it. The tell is vertical ratio: it dropped during the strides instead of climbing, meaning stride length grew faster than bounce did. That's the real-world signature of opening a stride safely rather than muscling through it — and it's why a full file, read together, catches things a single number never will.
Body position: the frame everything sits in
Strength training, matched to race pace
A 2024 systematic review and meta-analysis spanning 195 to 272 middle- and long-distance runners found that the right strength method depends on the pace being trained ³. Plyometric training produced a small improvement in running economy at speeds at or below roughly 12 km/h — long-course aerobic pace. Combined high-load and plyometric work showed a moderate improvement in the 10 to 14.5 km/h range. High-load strength training alone showed the clearest benefit at higher speeds and in athletes with higher VO2max ³. Submaximal-load and isometric-only training showed no significant benefit in this population.
Match the method to the pace you actually race, not the method that's trending.
A sample two-day strength program
Two 30-minute sessions a week, placed on easy or rest days — never the day before a key workout — cover the combined-method approach discussed above. Space them at least 48 hours apart.
The bottom line
1. Quick feet, not long feet
2. Run tall, not up
3. Lean from the ankles, not the waist
4. Drive the arms front-to-back
5. Finish the push — full hip extension
None of this requires overhauling a natural stride. It requires knowing which numbers on the watch are worth chasing — and which ones aren't.
Performance Testing includes video gait analysis alongside FTP and nutrition testing — a full picture of where your efficiency stands today.
Book a Coach Consultation Learn About One on One CoachingCoach Ted Geddis, USAT Elite Level 3 · Catalyst Endurance Coaching · catalystendurance.com
REFERENCES
1. Van Hooren, B., Jukic, I., Cox, M., Frenken, K.G., Bautista, I., & Moore, I.S. (2024). The relationship between running biomechanics and running economy: a systematic review and meta-analysis of observational studies. Sports Medicine, 54(5), 1269-1316.
2. Heiderscheit, B.C., Chumanov, E.S., Michalski, M.P., Wille, C.M., & Ryan, M.B. (2011). Effects of step rate manipulation on joint mechanics during running. Medicine & Science in Sports & Exercise, 43(2), 296-302.
3. Systematic review and meta-analysis (2024). Effect of strength training programs in middle- and long-distance runners' economy at different running speeds. Sports Medicine.
Train with purpose.